publications
(* denotes equal contribution. please see Google Scholar for an up-to-date list of publications.)
Preprint
- PreprintAnnual field-scale maps of tall and short crops at the global scale using GEDI and Sentinel-2Stefania Di Tommaso, Sherrie Wang, Vivek Vajipey, and 3 more authorsUnder review, Preprint
- PreprintCurrent benefits of wildfire smoke for yields in the US Midwest may dissipate by 2050A. Patrick Behrer, and Sherrie WangUnder review, Preprint
- PreprintMeta-learning to address diverse Earth observation problems across resolutionsMarc Russwurm, Sherrie Wang, Benjamin Kellenberger, and 2 more authorsUnder review, Preprint
- Book ChapterChapter A1.1: Agricultural ApplicationsSherrie Wang, and George AzzariIn Cloud-Based Remote Sensing with Google Earth Engine, Preprint
2022
-
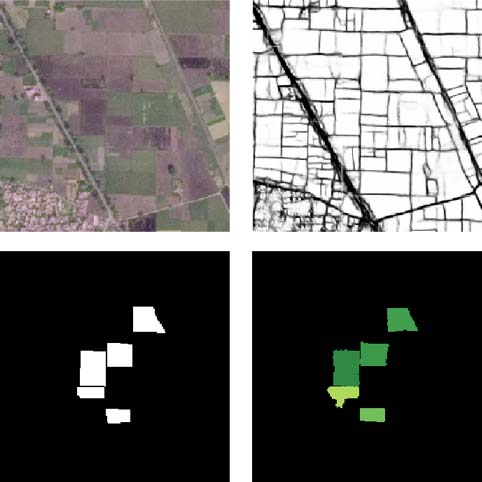 Unlocking large-scale crop field delineation in smallholder farming systems with transfer learning and weak supervisionSherrie Wang, Francois Waldner, and David B. LobellRemote Sensing, 2022
Crop field boundaries aid in mapping crop types, predicting yields, and delivering field-scale analytics to farmers. Recent years have seen the successful application of deep learning to delineating field boundaries in industrial agricultural systems, but field boundary datasets remain missing in smallholder systems due to (1) small fields that require high resolution satellite imagery to delineate and (2) a lack of ground labels for model training and validation. In this work, we use newly-accessible high-resolution satellite imagery and combine transfer learning with weak supervision to address these challenges in India. Our best model uses 1.5 m resolution Airbus SPOT imagery as input, pre-trains a state-of-the-art neural network on France field boundaries, and fine-tunes on India labels to achieve a median Intersection over Union (mIoU) of 0.85 in India. When we decouple field delineation from cropland classification, a model trained in France and applied as-is to India Airbus SPOT imagery delineates fields with a mIoU of 0.74. If using 4.8 m resolution PlanetScope imagery instead, high average performance (mIoU > 0.8) is only achievable for fields larger than 1 hectare. Experiments also show that pre-training in France reduces the number of India field labels needed to achieve a given performance level by as much as 10× when datasets are small. These findings suggest our method is a scalable approach for delineating crop fields in regions of the world that currently lack field boundary datasets. We publicly release 10,000 Indian field boundary labels and our delineation model to facilitate the creation of field boundary maps and new methods by the community.
@article{wang2022unlocking, title = {Unlocking large-scale crop field delineation in smallholder farming systems with transfer learning and weak supervision}, author = {Wang, Sherrie and Waldner, Francois and Lobell, David B.}, journal = {Remote Sensing}, volume = {14}, number = {22}, year = {2022}, } - ES&TDaily local-level estimates of ambient wildfire smoke PM2.5 for the contiguous USMarissa Childs, Jessica Li, Jeffrey Wen, and 7 more authorsEnvironmental Science & Technology, 2022
Smoke from wildfires is a growing health risk across the US. Understanding the spatial and temporal patterns of such exposure and its population health impacts requires separating smoke-driven pollutants from non-smoke pollutants and a long time series to quantify patterns and measure health impacts. We develop a parsimonious and accurate machine learning model of daily wildfire-driven PM2.5 concentrations using a combination of ground, satellite, and reanalysis data sources that are easy to update. We apply our model across the contiguous US from 2006 to 2020, generating daily estimates of smoke PM2.5 over a 10 km-by-10 km grid and use these data to characterize levels and trends in smoke PM2.5. Smoke contributions to daily PM2.5 concentrations have increased by up to 5 μg/m3 in the Western US over the last decade, reversing decades of policy-driven improvements in overall air quality, with concentrations growing fastest for higher income populations and predominantly Hispanic populations. The number of people in locations with at least 1 day of smoke PM2.5 above 100 μg/m3 per year has increased 27-fold over the last decade, including nearly 25 million people in 2020 alone. Our data set can bolster efforts to comprehensively understand the drivers and societal impacts of trends and extremes in wildfire smoke.
@article{childs2022daily, title = {Daily local-level estimates of ambient wildfire smoke {PM}2.5 for the contiguous {US}}, author = {Childs, Marissa and Li, Jessica and Wen, Jeffrey and Heft-Neal, Sam and Driscoll, Anne and Wang, Sherrie and Gould, Carlos and Qiu, Minghao and Burney, Jennifer and Burke, Marshall}, journal = {Environmental Science \& Technology}, volume = {56}, number = {19}, pages = {13607-13621}, year = {2022}, } - RSMapping sugarcane in central India with smartphone crowdsourcingJu Young Lee, Sherrie Wang, Anjuli Jain Figueroa, and 4 more authorsRemote Sensing, 2022
In India, the second-largest sugarcane producing country in the world, accurate mapping of sugarcane land is a key to designing targeted agricultural policies. Such a map is not available, however, as it is challenging to reliably identify sugarcane areas using remote sensing due to sugarcane’s phenological characteristics, coupled with a range of cultivation periods for different varieties. To produce a modern sugarcane map for the Bhima Basin in central India, we utilized crowdsourced data and applied supervised machine learning (neural network) and unsupervised classification methods individually and in combination. We highlight four points. First, smartphone crowdsourced data can be used as an alternative ground truth for sugarcane mapping but requires careful correction of potential errors. Second, although the supervised machine learning method performs best for sugarcane mapping, the combined use of both classification methods improves sugarcane mapping precision at the cost of worsening sugarcane recall and missing some actual sugarcane area. Third, machine learning image classification using high-resolution satellite imagery showed significant potential for sugarcane mapping. Fourth, our best estimate of the sugarcane area in the Bhima Basin is twice that shown in government statistics. This study provides useful insights into sugarcane mapping that can improve the approaches taken in other regions.
@article{lee2022mapping,
  title = {Mapping sugarcane in central India with smartphone crowdsourcing},
  author = {Lee, Ju Young and Wang, Sherrie and Figueroa, Anjuli Jain and Strey, Rob and Lobell, David B. and Naylor, Rosamond L. and Gorelick, Steven M.},
  journal = {Remote Sensing},
  volume = {14},
  number = {3},
  year = {2022},
}
2021
-
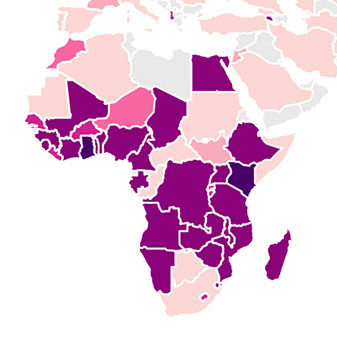 SustainBench: Benchmarks for monitoring the Sustainable Development Goals with machine learningChristopher Yeh*, Chenlin Meng*, Sherrie Wang*, and 7 more authorsNeurIPS Datasets and Benchmarks Track, 2021
Progress toward the United Nations Sustainable Development Goals (SDGs) has been hindered by a lack of data on key environmental and socioeconomic indicators, which historically have come from ground surveys with sparse temporal and spatial coverage. Recent advances in machine learning have made it possible to utilize abundant, frequently-updated, and globally available data, such as from satellites or social media, to provide insights into progress toward SDGs. Despite promising early results, approaches to using such data for SDG measurement thus far have largely evaluated on different datasets or used inconsistent evaluation metrics, making it hard to understand whether performance is improving and where additional research would be most fruitful. Furthermore, processing satellite and ground survey data requires domain knowledge that many in the machine learning community lack. In this paper, we introduce SustainBench, a collection of 15 benchmark tasks across 7 SDGs, including tasks related to economic development, agriculture, health, education, water and sanitation, climate action, and life on land. Datasets for 11 of the 15 tasks are released publicly for the first time. Our goals for SustainBench are to (1) lower the barriers to entry for the machine learning community to contribute to measuring and achieving the SDGs; (2) provide standard benchmarks for evaluating machine learning models on tasks across a variety of SDGs; and (3) encourage the development of novel machine learning methods where improved model performance facilitates progress towards the SDGs.
@article{yeh2021sustainbench, title = {SustainBench: Benchmarks for monitoring the Sustainable Development Goals with machine learning}, author = {Yeh*, Christopher and Meng*, Chenlin and Wang*, Sherrie and Driscoll, Anne and Rozi, Erik and Liu, Patrick and Lee, Jihyeon and Burke, Marshall and Lobell, David B. and Ermon, Stefano}, journal = {NeurIPS Datasets and Benchmarks Track}, year = {2021}, } - ERLCombining GEDI and Sentinel-2 for wall-to-wall mapping of tall and short cropsStefania Di Tommaso, Sherrie Wang, and David B. LobellEnvironmental Research Letters, 2021
High resolution crop type maps are an important tool for improving food security, and remote sensing is increasingly used to create such maps in regions that possess ground truth labels for model training. However, these labels are absent in many regions, and models trained on optical satellite features often exhibit low performance when transferred across geographies. Here we explore the use of NASA’s global ecosystem dynamics investigation (GEDI) spaceborne lidar instrument, combined with Sentinel-2 optical data, for crop type mapping. Using data from three major cropped regions (in China, France, and the United States) we first demonstrate that GEDI energy profiles can reliably distinguish maize, a crop typically above 2 m in height, from crops like rice and soybean that are shorter. We further show that these GEDI profiles provide much more invariant features across geographies compared to spectral and phenological features detected by passive optical sensors. GEDI is able to distinguish maize from other crops within each region with accuracies higher than 84%, and able to transfer across regions with accuracies higher than 82%, compared to 64% for transfer of optical features. Finally, we show that GEDI profiles can be used to generate training labels for models based on optical imagery from Sentinel-2, thereby enabling the creation of 10 m wall-to-wall maps of tall versus short crops in label-scarce regions. As maize is the second most widely-grown crop in the world and often the only tall crop grown within a landscape, we conclude that GEDI offers great promise for improving global crop type maps.
@article{ditommaso2021combining, title = {Combining GEDI and Sentinel-2 for wall-to-wall mapping of tall and short crops}, author = {Di Tommaso, Stefania and Wang, Sherrie and Lobell, David B.}, journal = {Environmental Research Letters}, volume = {16}, number = {12}, pages = {125002}, year = {2021}, } - RSETwo shifts for crop mapping: Leveraging aggregate crop statistics to improve satellite-based maps in new regionsDan M. Kluger, Sherrie Wang, and David B. LobellRemote Sensing of Environment, 2021
Crop type mapping at the field level is critical for a variety of applications in agricultural monitoring, and satellite imagery is becoming an increasingly abundant and useful raw input from which to create crop type maps. Still, in many regions crop type mapping with satellite data remains constrained by a scarcity of field-level crop labels for training supervised classification models. When training data is not available in one region, classifiers trained in similar regions can be transferred, but shifts in the distribution of crop types as well as transformations of the features between regions lead to reduced classification accuracy. We present a methodology that uses aggregate-level crop statistics to correct the classifier by accounting for these two types of shifts. To adjust for shifts in the crop type composition we present a scheme for properly reweighting the posterior probabilities of each class that are output by the classifier. To adjust for shifts in features we propose a method to estimate and remove linear shifts in the mean feature vector. We demonstrate that this methodology leads to substantial improvements in overall classification accuracy when using Linear Discriminant Analysis (LDA) to map crop types in Occitanie, France and in Western Province, Kenya. When using LDA as our base classifier, we found that in France our methodology led to percent reductions in misclassifications ranging from 2.8% to 42.2% (mean = 21.9%) over eleven different training departments, and in Kenya the percent reductions in misclassification were 6.6%, 28.4%, and 42.7% for three training regions. While our methodology was statistically motivated by the LDA classifier, it can be applied to any type of classifier. As an example, we demonstrate its successful application to improve a Random Forest classifier.
@article{kluger2021two,
  title = {Two shifts for crop mapping: Leveraging aggregate crop statistics to improve satellite-based maps in new regions},
  author = {Kluger, Dan M. and Wang, Sherrie and Lobell, David B.},
  journal = {Remote Sensing of Environment},
  volume = {262},
  pages = {112488},
  year = {2021},
}
2020
-
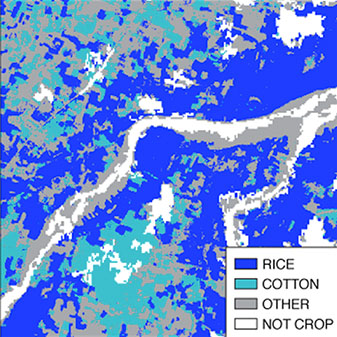 Mapping crop types in southeast India with smartphone crowdsourcing and deep learningSherrie Wang, Stefania Di Tommaso, Joey Faulkner, and 4 more authorsRemote Sensing, 2020
High resolution satellite imagery and modern machine learning methods hold the potential to fill existing data gaps in where crops are grown around the world at a sub-field level. However, high resolution crop type maps have remained challenging to create in developing regions due to a lack of ground truth labels for model development. In this work, we explore the use of crowdsourced data, Sentinel-2 and DigitalGlobe imagery, and convolutional neural networks (CNNs) for crop type mapping in India. Plantix, a free app that uses image recognition to help farmers diagnose crop diseases, logged 9 million geolocated photos from 2017–2019 in India, 2 million of which are in the states of Andhra Pradesh and Telangana in India. Crop type labels based on farmer-submitted images were added by domain experts and deep CNNs. The resulting dataset of crop type at coordinates is high in volume, but also high in noise due to location inaccuracies, submissions from out-of-field, and labeling errors. We employed a number of steps to clean the dataset, which included training a CNN on very high resolution DigitalGlobe imagery to filter for points that are within a crop field. With this cleaned dataset, we extracted Sentinel time series at each point and trained another CNN to predict the crop type at each pixel. When evaluated on the highest quality subset of crowdsourced data, the CNN distinguishes rice, cotton, and “other” crops with 74% accuracy in a 3-way classification and outperforms a random forest trained on harmonic regression features. Furthermore, model performance remains stable when low quality points are introduced into the training set. Our results illustrate the potential of non-traditional, high-volume/high-noise datasets for crop type mapping, some improvements that neural networks can achieve over random forests, and the robustness of such methods against moderate levels of training set noise. Lastly, we caution that obstacles like the lack of good Sentinel-2 cloud mask, imperfect mobile device location accuracy, and preservation of privacy while improving data access will need to be addressed before crowdsourcing can widely and reliably be used to map crops in smallholder systems.
@article{wang2020mapping2, title = {Mapping crop types in southeast India with smartphone crowdsourcing and deep learning}, author = {Wang, Sherrie and Di Tommaso, Stefania and Faulkner, Joey and Friedel, Thomas and Kennepohl, Alexander and Strey, Rob and Lobell, David B.}, issn = {2072-4292}, journal = {Remote Sensing}, number = {18}, volume = {12}, year = {2020}, } - Sci DataMapping twenty years of corn and soybean across the US Midwest using the Landsat archiveSherrie Wang, Stefania Di Tommaso, Jillian M. Deines, and 1 more authorScientific Data, 2020
Field-level monitoring of crop types in the United States via the Cropland Data Layer (CDL) has played an important role in improving production forecasts and enabling large-scale study of agricultural inputs and outcomes. Although CDL offers crop type maps across the conterminous US from 2008 onward, such maps are missing in many Midwestern states or are uneven in quality before 2008. To fill these data gaps, we used the now-public Landsat archive and cloud computing services to map corn and soybean at 30 m resolution across the US Midwest from 1999–2018. Our training data were CDL from 2008–2018, and we validated the predictions on CDL 1999–2007 where available, county-level crop acreage statistics, and state-level crop rotation statistics. The corn-soybean maps, which we call the Corn-Soy Data Layer (CSDL), are publicly hosted on Google Earth Engine and also available for download online.
@article{wang2020mapping1, title = {Mapping twenty years of corn and soybean across the US Midwest using the Landsat archive}, author = {Wang, Sherrie and Di Tommaso, Stefania and Deines, Jillian M. and Lobell, David B.}, journal = {Scientific Data}, number = {1}, pages = {307}, volume = {7}, year = {2020}, } -
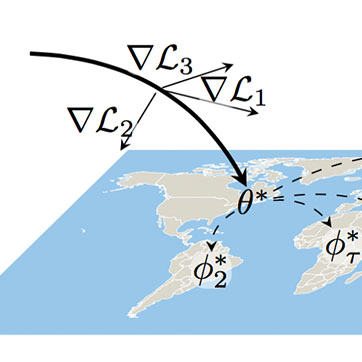 Meta-learning for few-shot land cover classificationMarc Rußwurm*, Sherrie Wang*, Marco Körner, and 1 more author2020 IEEE/CVF Conference on Computer Vision and Pattern Recognition Workshops (CVPRW), 2020
The representations of the Earth’s surface vary from one geographic region to another. For instance, the appearance of urban areas differs between continents, and seasonality influences the appearance of vegetation. To capture the diversity within a single category, such as urban or vegetation, requires a large model capacity and, consequently, large datasets. In this work, we propose a different perspective and view this diversity as an inductive transfer learning problem where few data samples from one region allow a model to adapt to an unseen region. We evaluate the modelagnostic meta-learning (MAML) algorithm on classification and segmentation tasks using globally and regionally distributed datasets. We find that few-shot model adaptation outperforms pre-training with regular gradient descent and fine-tuning on the (1) Sen12MS dataset and (2) DeepGlobe dataset when the source domain and target domain differ. This indicates that model optimization with meta-learning may benefit tasks in the Earth sciences whose data show a high degree of diversity from region to region, while traditional gradient-based supervised learning remains suitable in the absence of a feature or label shift.
@article{russwurm2020meta, title = {Meta-learning for few-shot land cover classification}, author = {Ru{\ss}wurm*, Marc and Wang*, Sherrie and K{\"o}rner, Marco and Lobell, David B.}, journal = {2020 IEEE/CVF Conference on Computer Vision and Pattern Recognition Workshops (CVPRW)}, pages = {788-796}, year = {2020}, } - RSWeakly supervised deep learning for segmentation of remote sensing imagerySherrie Wang, William Chen, Sang Michael Xie, and 2 more authorsRemote Sensing, 2020
Accurate automated segmentation of remote sensing data could benefit applications from land cover mapping and agricultural monitoring to urban development surveyal and disaster damage assessment. While convolutional neural networks (CNNs) achieve state-of-the-art accuracy when segmenting natural images with huge labeled datasets, their successful translation to remote sensing tasks has been limited by low quantities of ground truth labels, especially fully segmented ones, in the remote sensing domain. In this work, we perform cropland segmentation using two types of labels commonly found in remote sensing datasets that can be considered sources of “weak supervision”: (1) labels comprised of single geotagged points and (2) image-level labels. We demonstrate that (1) a U-Net trained on a single labeled pixel per image and (2) a U-Net image classifier transferred to segmentation can outperform pixel-level algorithms such as logistic regression, support vector machine, and random forest. While the high performance of neural networks is well-established for large datasets, our experiments indicate that U-Nets trained on weak labels outperform baseline methods with as few as 100 labels. Neural networks, therefore, can combine superior classification performance with efficient label usage, and allow pixel-level labels to be obtained from image labels.
@article{wang2020weakly,
  title = {Weakly supervised deep learning for segmentation of remote sensing imagery},
  author = {Wang, Sherrie and Chen, William and Xie, Sang Michael and Azzari, George and Lobell, David B.},
  journal = {Remote Sensing},
  issn = {2072-4292},
  number = {2},
  volume = {12},
  year = {2020},
}
2019
- ERLSatellites reveal a small positive yield effect from conservation tillage across the US Corn BeltJillian M. Deines, Sherrie Wang, and David B. LobellEnvironmental Research Letters, 2019
Conservation tillage is a primary tenet of conservation agriculture aimed at restoring and maintaining soil health for long-term crop productivity. Because soil degradation typically operates on century timescales, farmer adoption is influenced by near-term yield impacts and profitability. Although numerous localized field trials have examined the yield impacts of conservation tillage, their results are mixed and often unrepresentative of real-world conditions. Here, we applied a machine-learning causal inference approach to satellite-derived datasets of tillage practices and crop yields spanning the US Corn Belt from 2005 to 2017 to assess on-the-ground yield impacts at field-level resolution across thousands of fields. We found an average 3.3% and 0.74% yield increase for maize and soybeans, respectively, for fields with long-term conservation tillage. This effect was diminished in fields that only recently converted to conservation tillage. We also found significant variability in these effects, and we identified soil and weather characteristics that mediate the direction and magnitude of yield responses. This work supports soil conservation practices by demonstrating they can be used with minimal and typically positive yield impacts.
@article{deines2019satellites, title = {Satellites reveal a small positive yield effect from conservation tillage across the US Corn Belt}, author = {Deines, Jillian M. and Wang, Sherrie and Lobell, David B.}, journal = {Environmental Research Letters}, number = {12}, pages = {124038}, volume = {14}, year = {2019}, } - AAAITile2Vec: Unsupervised representation learning for spatially distributed dataNeal Jean, Sherrie Wang, Anshul Samar, and 3 more authorsProceedings of the AAAI Conference on Artificial Intelligence, 2019
Geospatial analysis lacks methods like the word vector representations and pre-trained networks that significantly boost performance across a wide range of natural language and computer vision tasks. To fill this gap, we introduce Tile2Vec, an unsupervised representation learning algorithm that extends the distributional hypothesis from natural language – words appearing in similar contexts tend to have similar meanings – to spatially distributed data. We demonstrate empirically that Tile2Vec learns semantically meaningful representations for both image and non-image datasets. Our learned representations significantly improve performance in downstream classification tasks and, similarly to word vectors, allow visual analogies to be obtained via simple arithmetic in the latent space.
@article{jean2019tile2vec, title = {Tile2Vec: Unsupervised representation learning for spatially distributed data}, author = {Jean, Neal and Wang, Sherrie and Samar, Anshul and Azzari, George and Lobell, David and Ermon, Stefano}, journal = {Proceedings of the AAAI Conference on Artificial Intelligence}, volume = {33}, number = {01}, pages = {3967--3974}, year = {2019}, } - RSECrop type mapping without field-level labels: Random forest transfer and unsupervised clustering techniquesSherrie Wang, George Azzari, and David B. LobellRemote Sensing of Environment, 2019
Crop type mapping at the field level is necessary for a variety of applications in agricultural monitoring and food security. As remote sensing imagery continues to increase in spatial and temporal resolution, it is becoming an increasingly powerful raw input from which to create crop type maps. Still, automated crop type mapping remains constrained by a lack of field-level crop labels for training supervised classification models. In this study, we explore the use of random forests transferred across geographic distance and time and unsupervised methods in conjunction with aggregate crop statistics for crop type mapping in the US Midwest, where we simulated the label-poor setting by depriving the models of labels in various states and years. We validated our methodology using available 30 m spatial resolution crop type labels from the US Department of Agriculture’s Cropland Data Layer (CDL). Using Google Earth Engine, we computed Fourier transforms (or harmonic regressions) on the time series of Landsat Surface Reflectance and derived vegetation indices, and extracted the coefficients as features for machine learning models. We found that random forests trained on regions and years similar in growing degree days (GDD) transfer to the target region with accuracies consistently exceeding 80%. Accuracies decrease as differences in GDD expand. Unsupervised Gaussian mixture models (GMM) with class labels derived using county-level crop statistics classify crops less consistently but require no field-level labels for training. GMM achieves over 85% accuracy in states with low crop diversity (Illinois, Iowa, Indiana, Nebraska), but performs sometimes no better than random when high crop diversity interferes with clustering (North Dakota, South Dakota, Wisconsin, Michigan). Under the appropriate conditions, these methods offer options for field-resolution crop type mapping in regions around the world with few or no ground labels.
@article{wang2019crop,
  title = {Crop type mapping without field-level labels: Random forest transfer and unsupervised clustering techniques},
  author = {Wang, Sherrie and Azzari, George and Lobell, David B.},
  journal = {Remote Sensing of Environment},
  volume = {222},
  pages = {303--317},
  year = {2019},
  issn = {0034-4257},
}